Open the app
Open the shared website in your browser. Use Kymographs to compare experiments, Library to explore the papers, and Test plan to review candidate analyses. Published figures and source links are loaded from their original hosts.
RESEARCH EXPLORER · V7.1
中文Open the shared website in your browser. Use Kymographs to compare experiments, Library to explore the papers, and Test plan to review candidate analyses. Published figures and source links are loaded from their original hosts.
English is the default on first use. The top-right switch remembers your choice in this browser and preserves filters, selected papers, the current view, and your notes. User-written notes are never translated.
Experiments use sequential orange-red (OrRd): light values are low and dark values are high. Blue (Blues) remains reserved for simulations; simulation arrays are not yet connected. Colorbars increase from bottom to top. Each complete sample is independently normalized to 0–1, so colors cannot compare absolute concentrations across papers. Gray denotes missing or unsampled values.
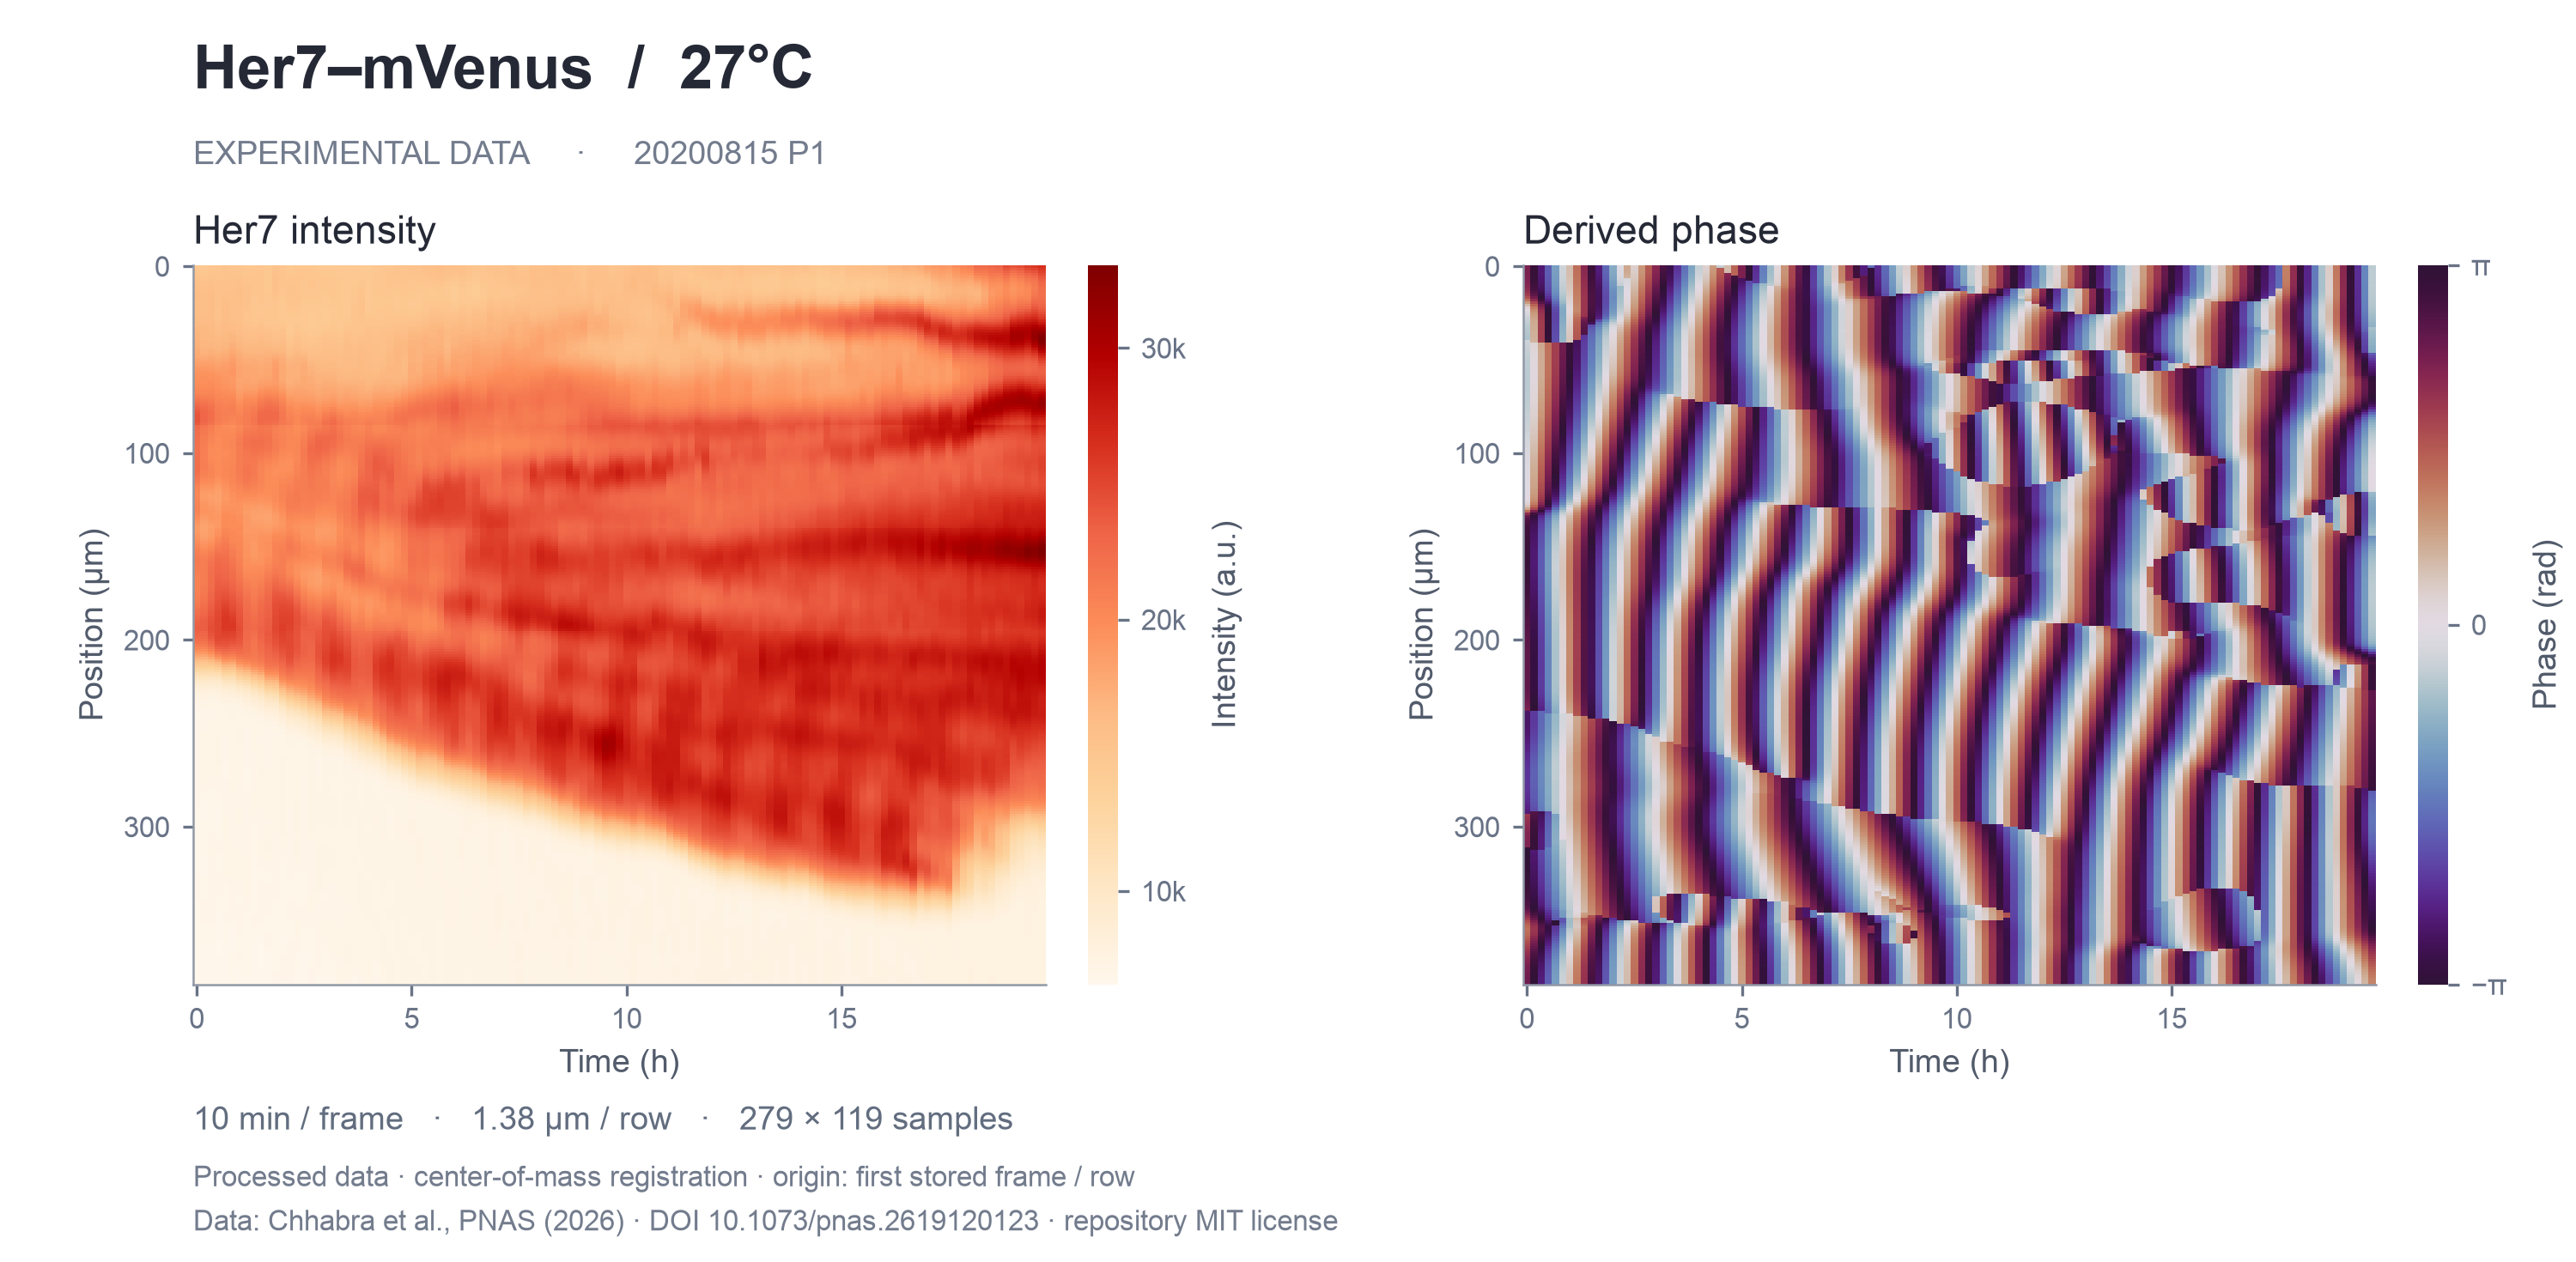
Chhabra uses a processed matrix from the 27°C sample. Lauschke and Sonnen use grayscale video ROIs. Rohde uses binned cell-intensity tracks at 28.5°C. Yaman uses an author-provided example matrix: its channel, sample condition, and physical spatial calibration are unspecified. The 37°C label is from the paper's methods, not file-level metadata.
Sanaki-Matsumiya and Miao appear separately as Video color estimates. These approximate color indices from pseudocolor movies, not raw fluorescence. Rejecting pixels with poor color matching may selectively remove bright regions. Miao uses only the early 50.500–63.913 h window; MESP2 mixing cannot be excluded. Use these two redraws qualitatively, not to fit amplitude, cellular period, or propagation speed.
The shared view spans 0–10 h. Compatible local-distance axes use 0–400 µm; uncalibrated row/pixel axes and image-centered axes retain their own ranges and units. Full duration preserves each record's complete time and position range. In Miao, displayed 0 h corresponds to differentiation time 50.5 h. Rohde retains all 300 acquisition columns, but the displayed PSM4 cohort has measurements only at 0.25–5.50 h. Its gray boundary is not a tissue front.
Open Figure & method for calibration and caveats, or Inspect ROI for sampling geometry. Comparison PDFs are paginated by data group; individual figures also offer SVG and PNG downloads. A separate Masamizu method preview retains frame/pixel coordinates rather than implying unverified physical calibration.
Search or filter the Library, then open a paper for Overview, Figures, Data, Evidence, and Notes. Select 2–3 papers for a metadata comparison. Verification labels distinguish a readable file from an attachment listing, a successful header response, or evidence for raw data.
Notes and review decisions are saved in this browser's localStorage. JSON export includes notes and the current filtered catalogue; CSV exports one row per paper. Reset filters to export the full library. Exports identify the current interface language. Notes do not modify disk files or upload anywhere. Notes are private to this browser and website address; they are not shared with colleagues. Notes from the local app do not automatically transfer here. Use JSON export for backup; importing notes is not currently supported.
Open each paper’s Data and Evidence tabs for the original source, available numerical samples, and processing records. Figure downloads include SVG, PDF, and PNG. Source hashes, axis ranges, and transformations are recorded in comparison metadata.
Chhabra’s native intensity and phase figures retain the complete 279 × 119 matrices, with 10 min and 1.38 µm calibration. The phase map has no added low-signal quality mask, so background phase requires caution. See the paired intensity / phase figure.
Full source movies are linked from the papers and are not hosted here. Derived matrices and processing records remain available; Miao’s saved matrix retains absolute time, while the comparison renderer subtracts 50.5 h.
The catalogue is data/literature.json; CSV is a full snapshot. The evidence/ folder contains verification records, and per-dataset provenance is in data/derived/. Supplementary raw stacks may exist outside the sources successfully accessed. A public figure, a file named “Data,” or a repository tagged “Dataset” does not establish that a raw imaging stack is available.
Delaune and Shih remain without a readable time series in this collection. Fixed embryos cannot be assembled into a measured time-lapse kymograph. Published figures are retained for visual context, with source and attribution; they do not replace numerical data for fitting.
The Ilagan paper is a Notch reporter-method reference rather than a somitogenesis kymograph dataset. The medaka bioRxiv paper is retained alongside its 2026 PNAS publication. Poster comparison uses the user's supplied screenshots. The research poster provides the project context. The original simulation plotting default was checked read-only; training results and simulation files were not changed.